
Debugging can be like finding a black cat in a dark room... Turn on the lights so the black cat is easily seen.
The comprehensive ClariFi™ Debugger and Protocol Analyzer bring robust devices into production faster. Our power to solve problems is your competitive advantage.
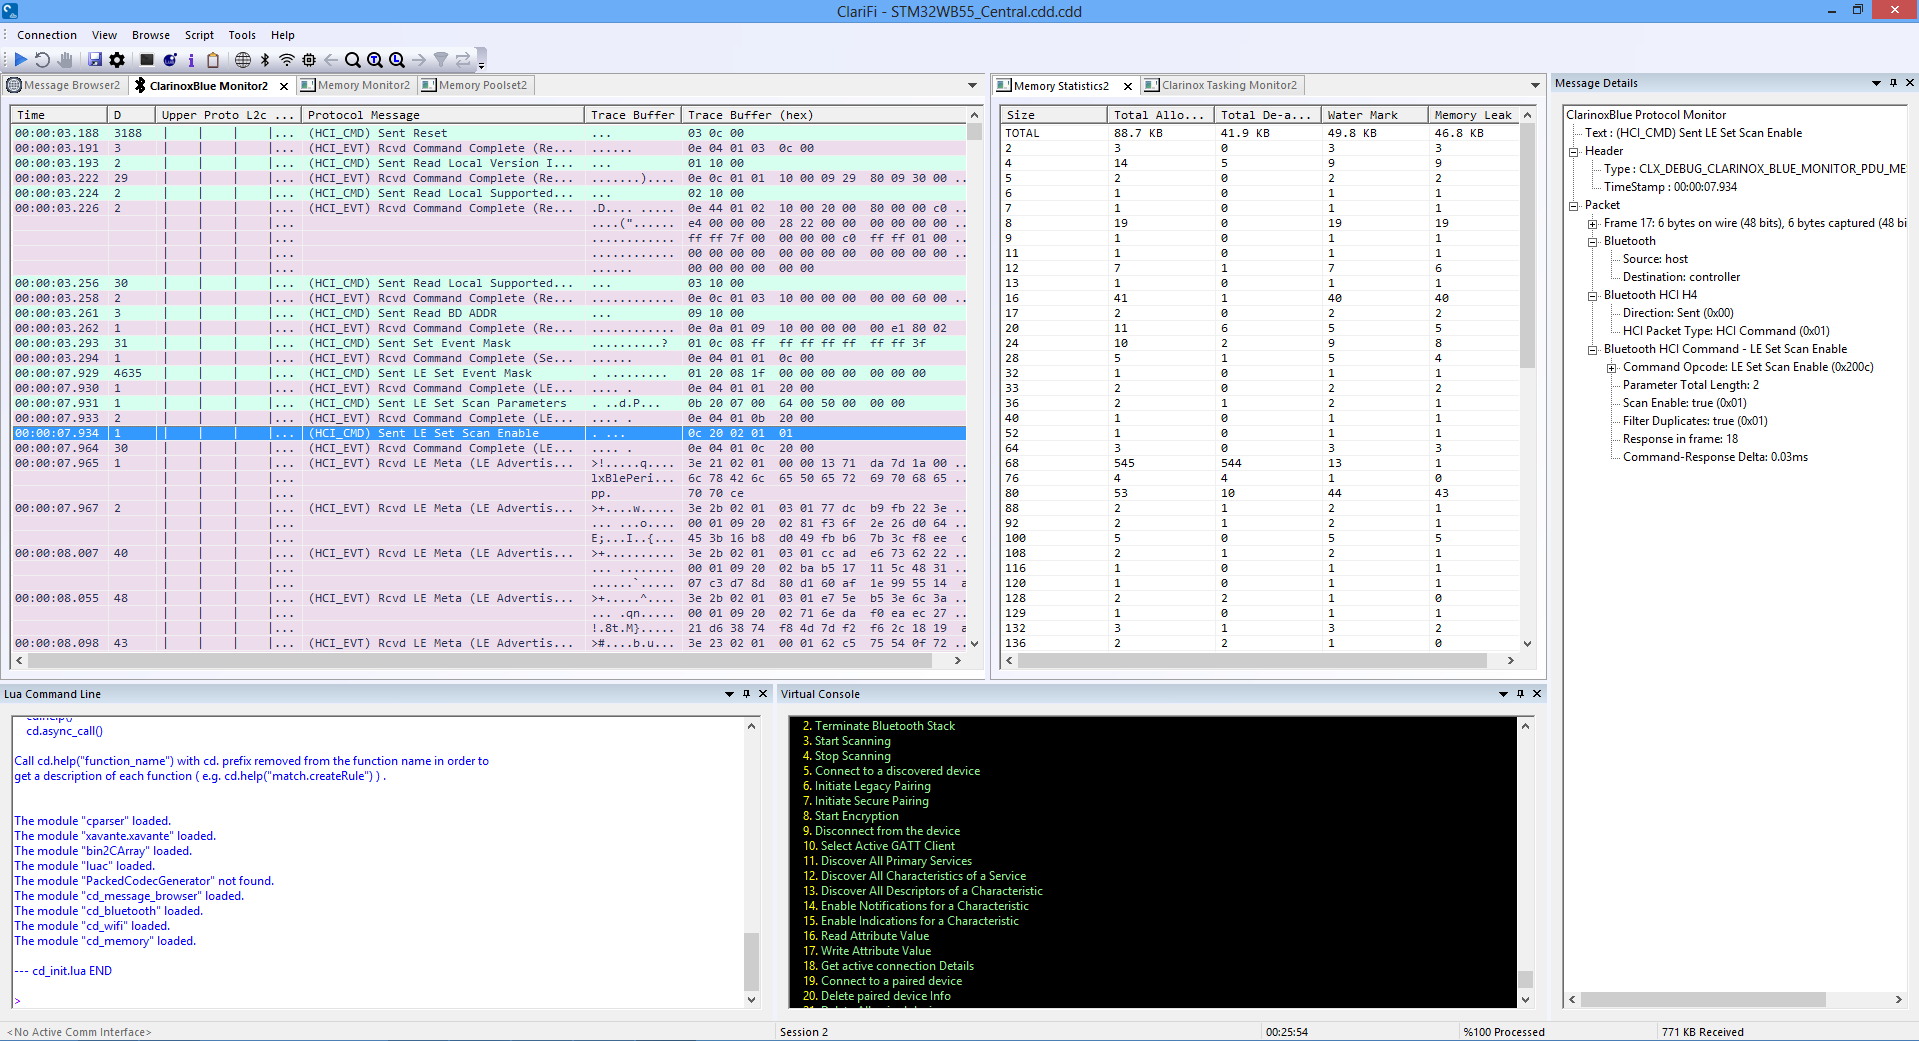
ClariFi™ provides an in-built protocol analyzer support for faster debugging of complex wireless devices and is used with our user-friendly SoftFrame abstraction layer middleware. It offers threading, memory usage, and memory leak analysis. Together these tools support the tuning of applications and aid in communicating issues. Users can add custom plug-ins as required, with a console interface via a single physical medium.
Two distinct modes are available. Firstly, as an advanced logger, and secondly, as an interactive tool to run tests on a target device using ClariFi™ Test Architecture. The test architecture platform provides an automated test environment for embedded developers to quickly run tests on their target device without recompilation. This is achieved through a simple Lua scripting interface whereby a target device is configured as a server device that responds to requests from the ClariFi™ client interface.
Users communicate possible issues by storing and exchanging debugger log files with their team members or Clarinox.
Plug-ins can pass specific messages to the debug tools sent by the debug target. By defining plug-ins via the plug-in interface, flexibility is provided for developers to add their own debugging functionality.
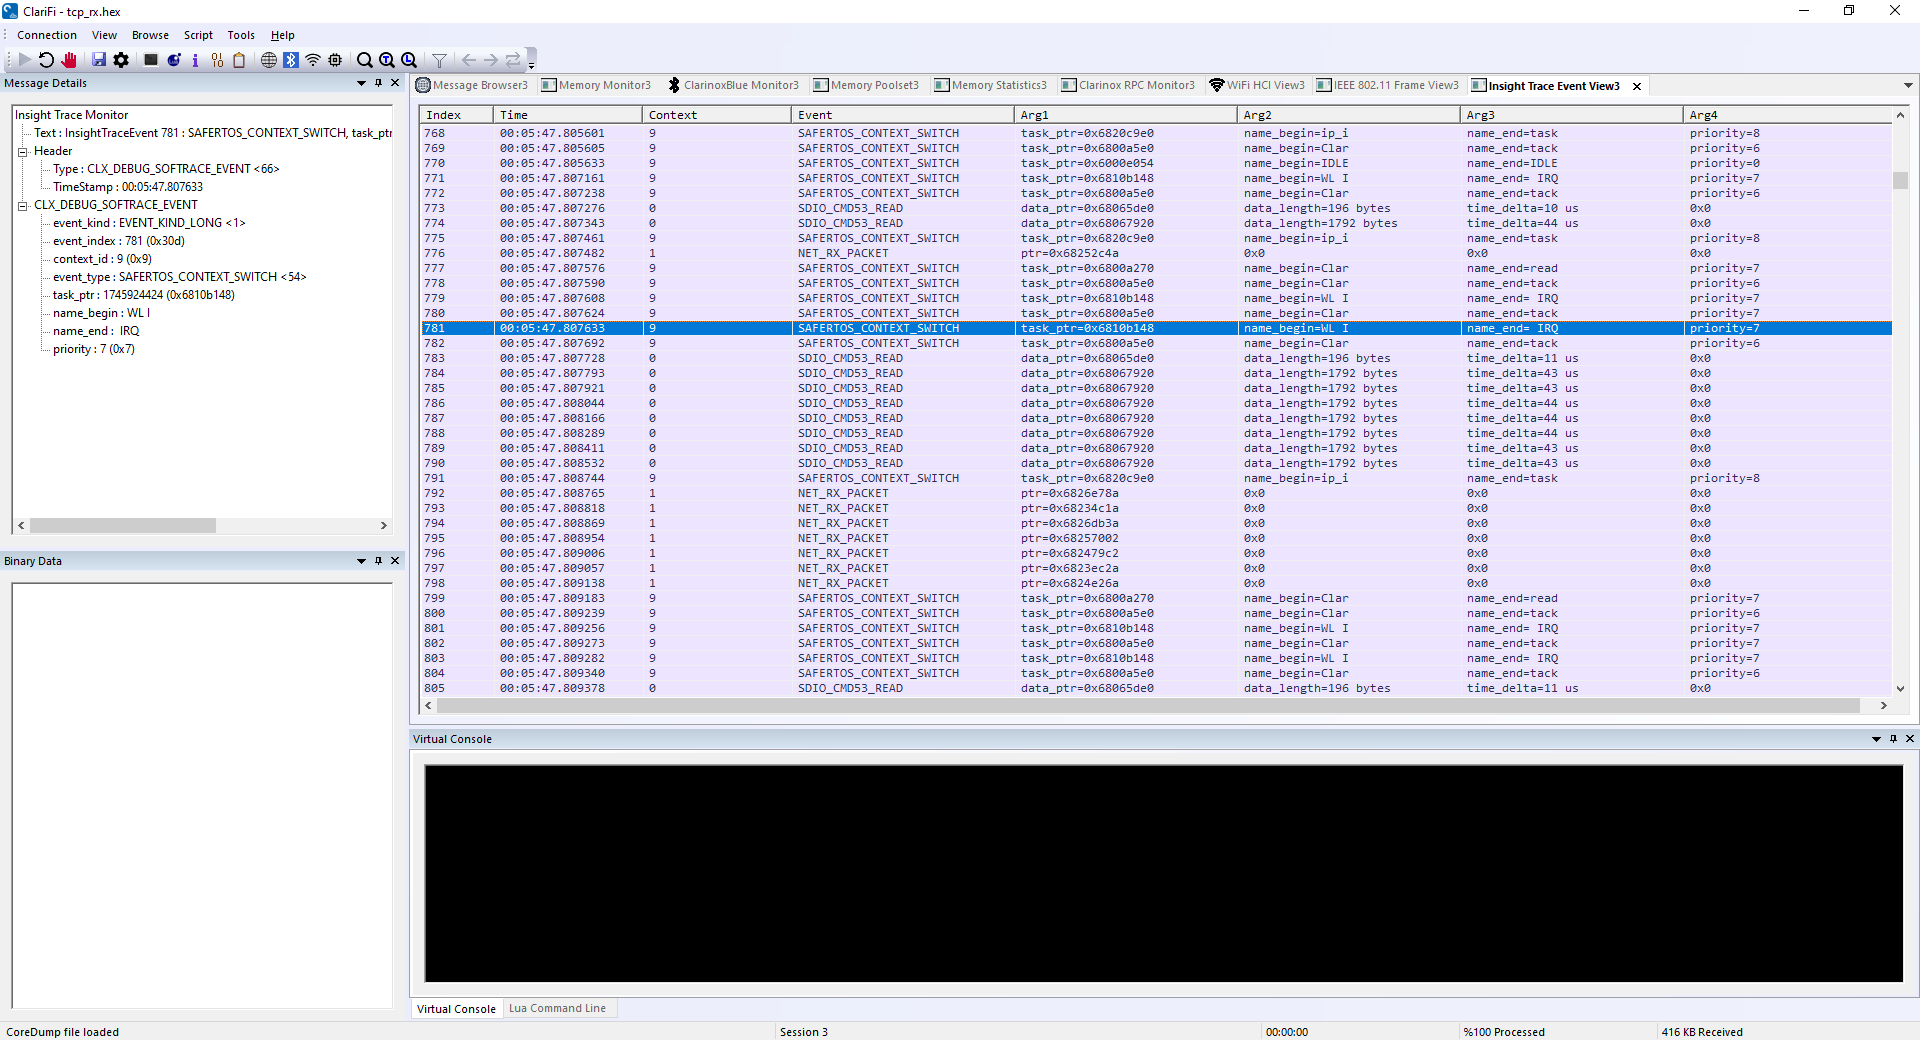
ClariFi™ Insight offers small-footprint, non-intrusive tracing for ClarinoxBlue and ClarinoxWiFi. ClariFi™ Insight traces the behavior of a system, enabling developers to more easily identify and correct errant application behavior by capturing high-speed events. This has been successfully tested at speeds of 100mbit/s UDP over Wi-Fi.
ClariFi™ Insight uses a small memory buffer at a set memory location to trace functionality. A buffer - as small as a few kilobytes - is sufficient to enable a developer to debug a system crash or capture what is happening on the target.
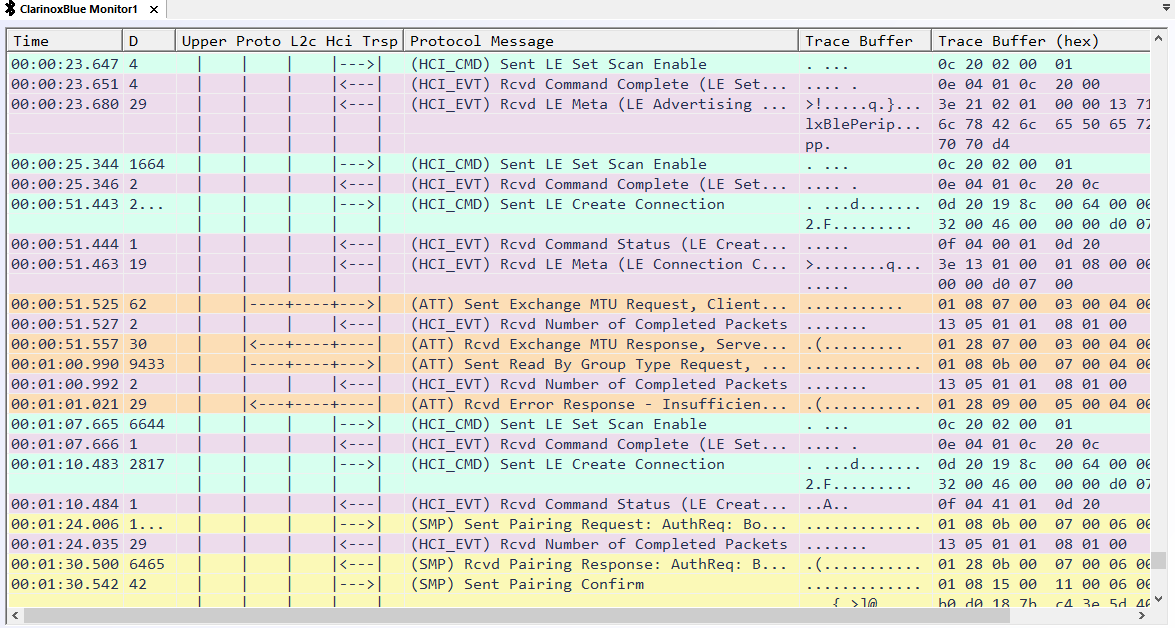
The ClarinoxBlue™ monitor allows developers to view detailed information regarding all incoming and outgoing HCI and ACL data packets. Features like the layer interaction column provide useful visualization to developers less familiar with Bluetooth Low Energy & Classic protocols. For each captured Bluetooth® message, users can see the transmission time, layer interaction, trace buffer, and protocol used.
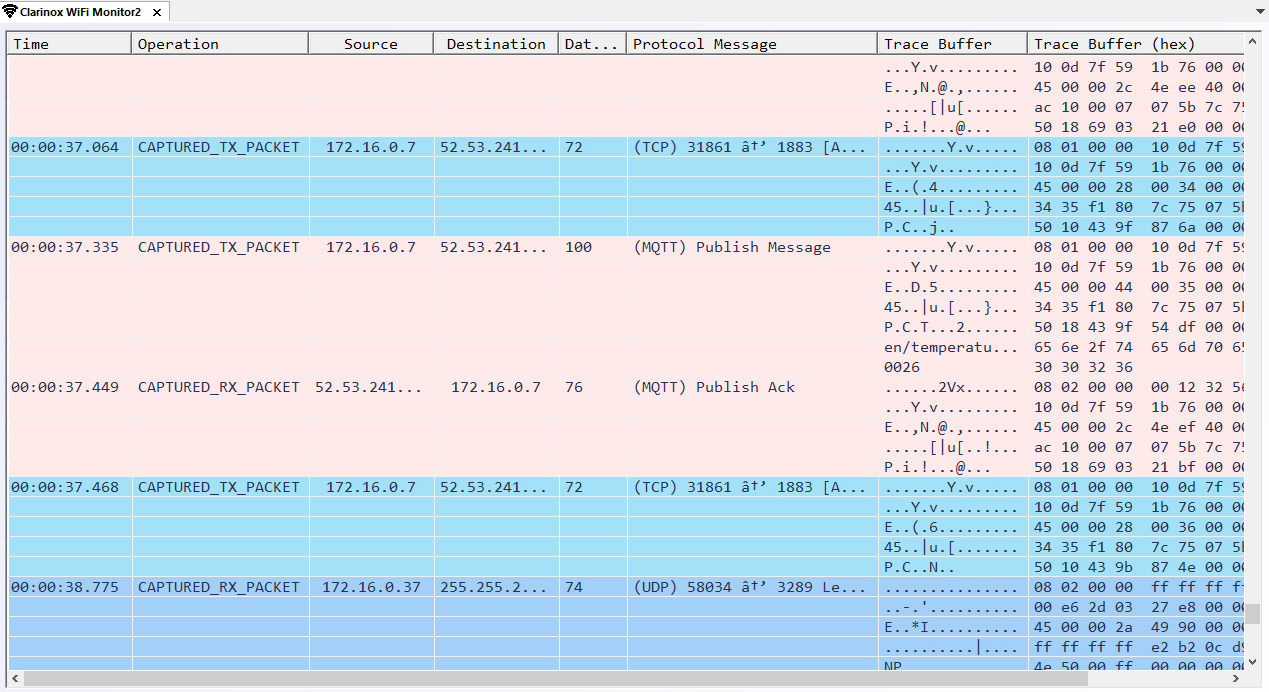
Our ClarinoxWiFi™ monitor lets developers see all received and transmitted messages from their wireless-enabled embedded hardware. This can provide developers with a high-level protocol interface and SDIO messages for debugging low-level communication with a wireless IC.
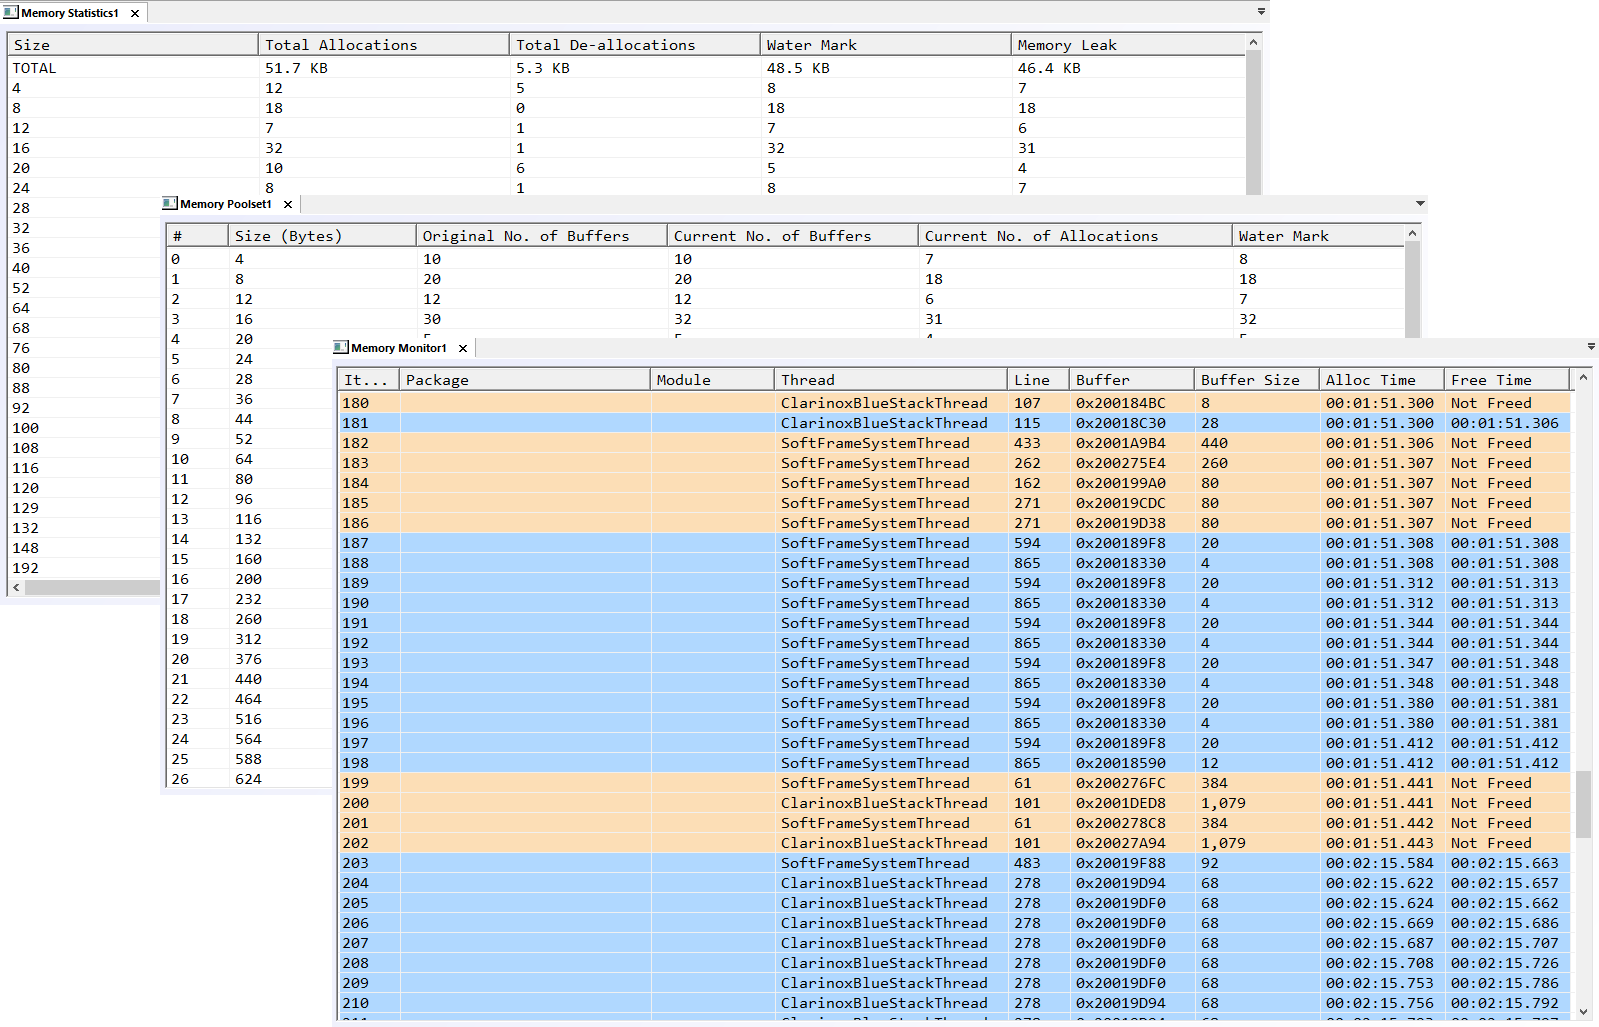
ClariFi™ Memory analysis tools will ensure that you quickly find memory leaks in your embedded application. These tools will let you know the allocations, de-allocations, statistics, address, size, system thread, and even the line number of where your buffer is being allocated memory.
Included memory analysis tools:
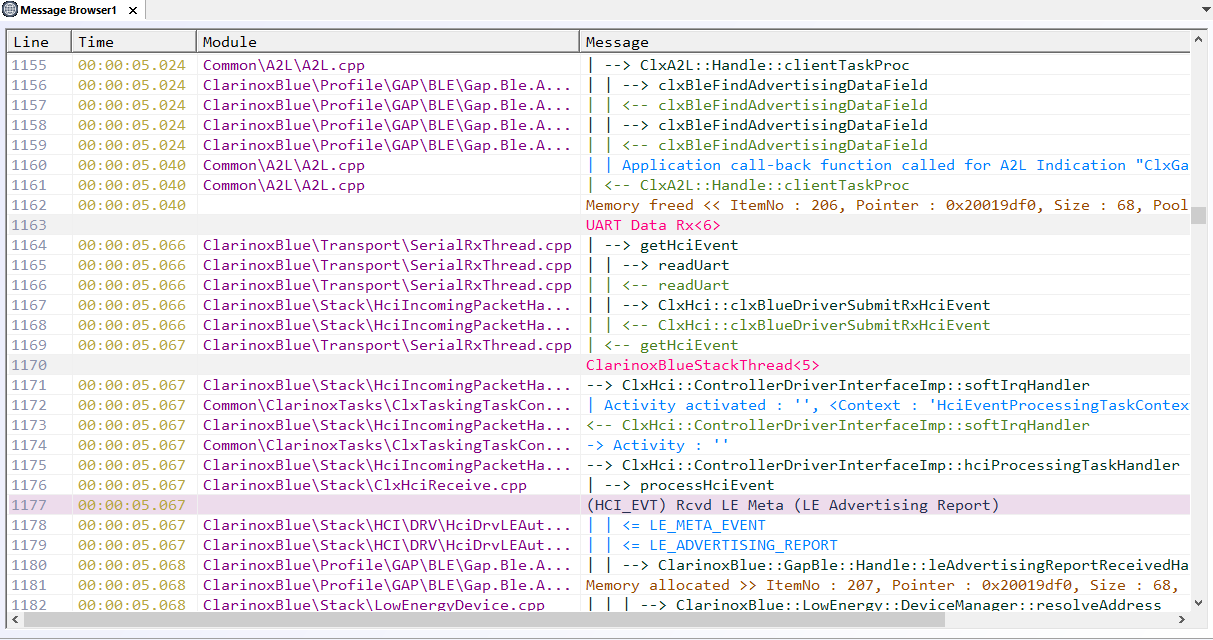
Our Message browser tool lets developers get a high-level overview of their application running in real-time. This becomes very useful to developers debugging RTOS applications who want to ensure that threads execute within their allocated time frame.
Integrated Lua engine allows exclusive message matching to search, highlight or filter out messages while analyzing debug data.
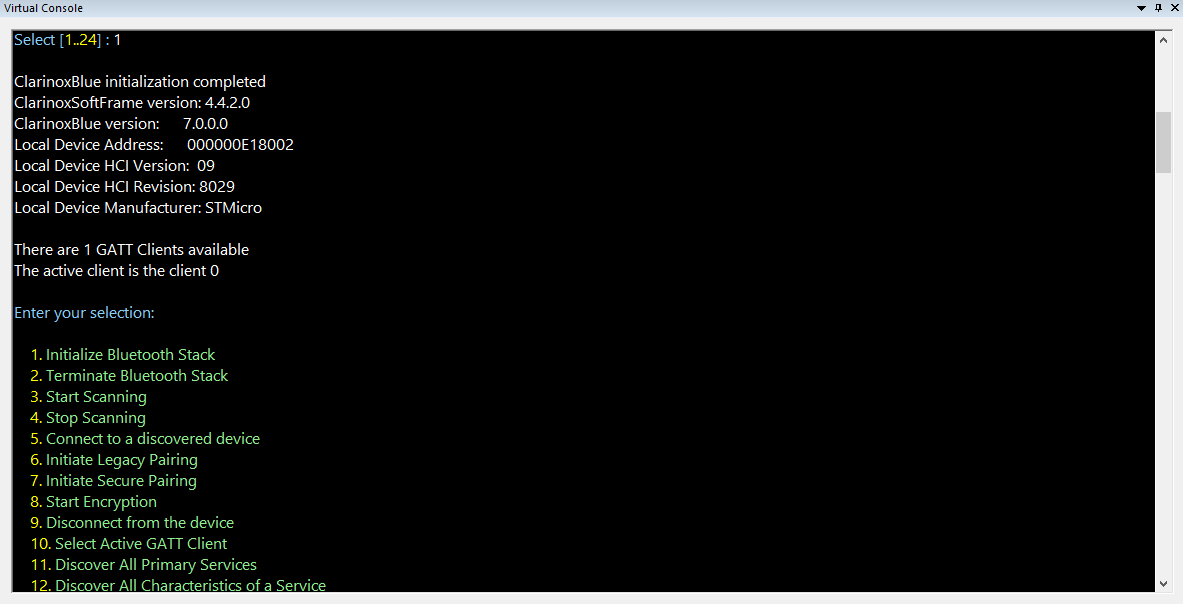
The built-in virtual console allows developers to interact with their embedded hardware through a command-based interface over UART, TCP/IP server, or JLink RTT. This becomes useful when needing user input for your embedded application and eliminates the need for hardware input devices.
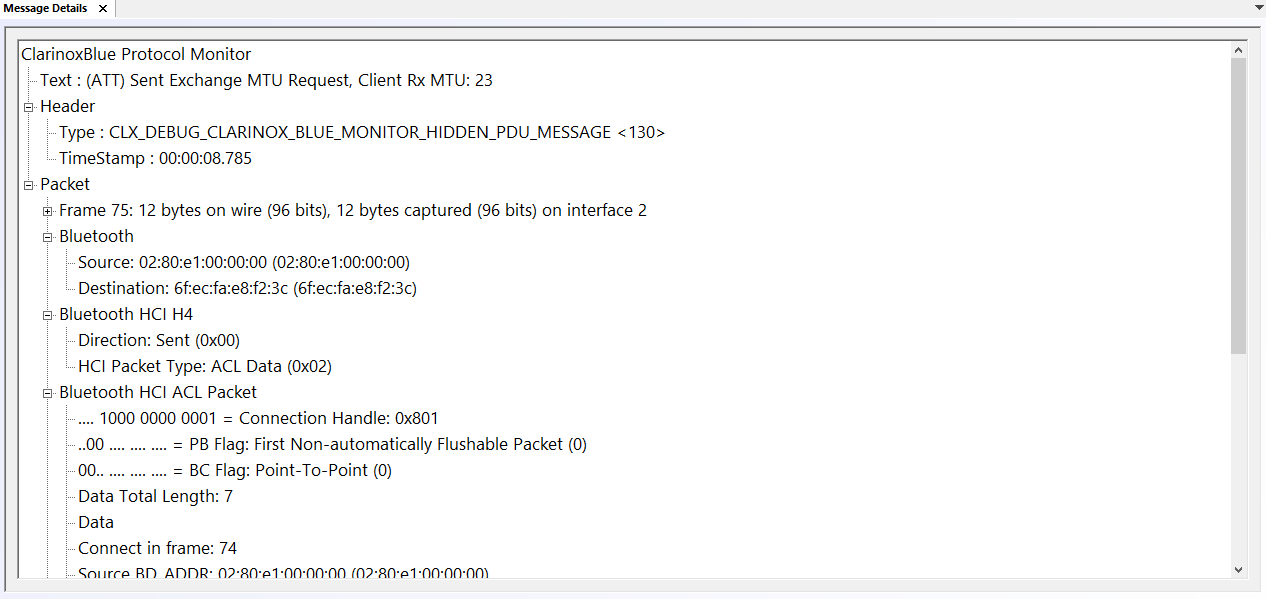
The message details panel gives the most power to developers by allowing them to click on any individual ClarinoxBlue™, ClarinoxWiFi™, Message browser, or Memory monitor message to view further information for that message.
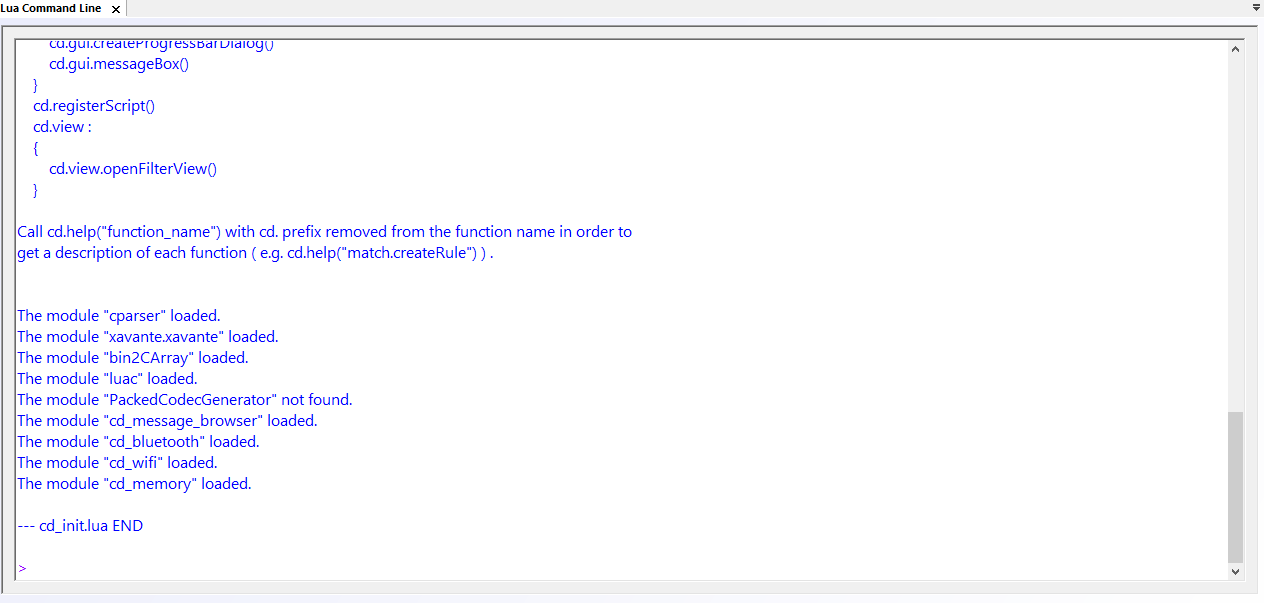
ClariFi™ is integrated with the Lua engine and terminal to enable the simple execution of Lua commands. The Lua engine provides the following:
Clarinox announces Bluetooth™ and Wi-Fi support for Renesas RA Microcontroller Family:
Debugging: Wikipedia states that "Debugging is, in general, a lengthy and tiresome task." ... for debugging discussion Comments from readers On 04/28 ...
Short Range Wireless Usage, Concerns, Directions and Debugging in the IoT Era: The world of embedded is changing. It is being impacted by one of the m ...

A robust Bluetooth Classic/LE protocol stack, Auracast and Mesh ready , supporting over 15 different RTOS. ClarinoxBlue is a dev- friendly stack, that offers advance embedded connectivity solutions.

A proven Wi-Fi protocol stack with AP, STA P2P, WPS, Mesh, ported to over 15 different RTOS. Clarinox Wi-Fi empowers developers to create reliable and high-performance embedded Wi-Fi connections.

ClariFi™ an all-in-one high-level debugger with integrated Bluetooth and Wi-Fi sniffers, protocol analysis, memory optimization, leak analysis, and detailed thread/task insights.

Our versatile protocol stacks operate seamlessly on the Clarinox SoftFrame abstraction layer, facilitating swift portability,co-existence, and interoperability.